María Ángeles Horrillo Muñoz - Senior Expert, Technical Area and Reinsurance Sub-directorate
Belén Soriano Cavero - Deputy-Director for the Technical Area and Reinsurance
Francisco Espejo Gil - Deputy-Director for Studies and International Relations
Consorcio de Compensación de Seguros

The Consorcio de Compensación de Seguros' compilation of Extraordinary Risk Statistics is published yearly and is one of its longest standing and most impactful publications. Its latest issue in 2020 presents statistics on the claims paid by the Consorcio over the past 49 years (time series for 1971-2019). Except as otherwise indicated, this paper analyses and presents the data for the last 25 years, 1995-2019, a time span for which a uniform level of detail is available and claims have been handled using the same data processing system. Furthermore, the period is sufficiently long and includes the worst events for each cause currently covered, so it is representative.
The losses considered are claims for which indemnities had been paid or set aside (provisions for outstanding claims) on the closing date for data collection (29 February 2020). Therefore, losses incurred but not reported have not been included and these statistics will be expanded subsequently as reports come in.
Indemnities are accounted excluding deductibles and applying the rule of proportional insurance where applicable. Claim handling costs, such as payments to loss adjusters and lawyers and other expenses, have also not been included.
Loss distributions have been based on the date of occurrence of the loss, irrespective of the reporting or payment date.
Amounts have been expressed in millions of current euros current on 31 December 2019.
The information has been structured as follows:
1. Property damage.
1.1 Loss rate by cause.
1.2 Loss rate by cause and risk category.
1.3 Loss rate by cause and month of occurrence.
1.4 Loss rate by cause and province of occurrence.
2. Property Damage, Business Interruption (Pecuniary Losses), and Personal Injury.
2.1 Loss rate by cause.
2.2 Loss rate by the most significant events in the series.
3. Property damage: Premium consumption and loss frequency.
1. PROPERTY DAMAGE
1.1 LOSS RATE BY CAUSE
Property damage has been analysed as the modality that accounts for the greatest share of the losses indemnified by the Consorcio de Compensación de Seguros (CCS).

Figure 1. Breakdown of total damage by cause, natural or man-made, over the past 25 years.

Figure 2. Breakdown of total damage by main causes over the past 25 years.
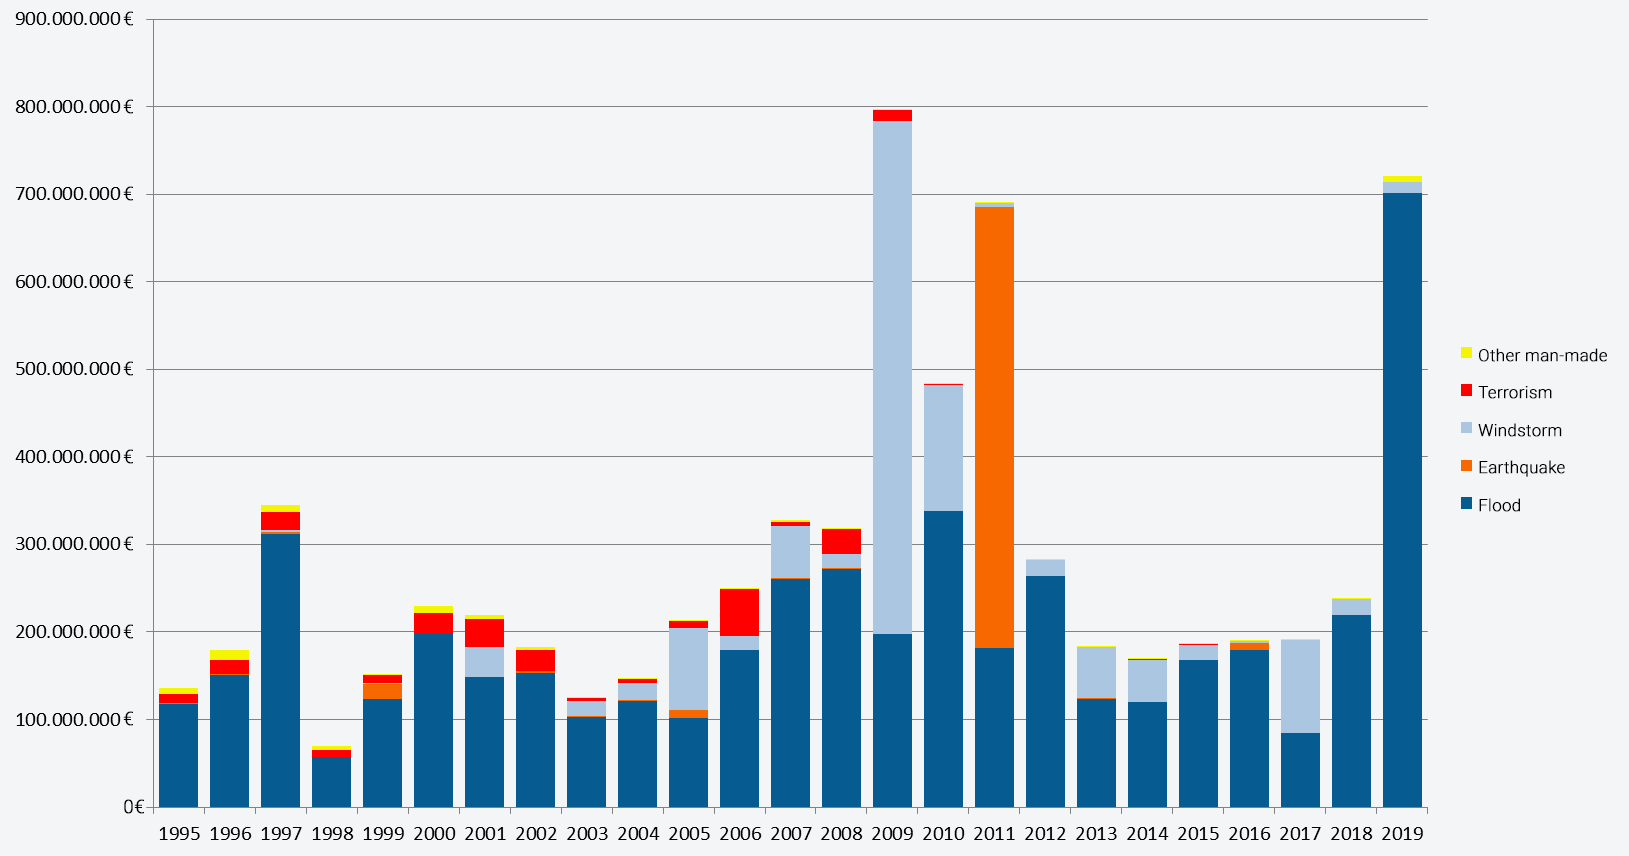
Figure 3. Breakdown of total damage by cause by year over the past 25 years.
The analysis of the loss rate by main causes is graphically represented in Figures 1, 2, and 3 and in Table 1. The first conclusion is that over the past 25 years, 95 % of the 7,031 million 2019 euros paid as compensation for 1,294,171 separate claims had a natural cause, and only 5 % were directly attributable to the hand of man. In numbers, damage due to natural causes accounted for 6,702 million euros (in 1,274,104 separate claims, 98 % of the total), while damage due to man-made causes accounted for 329 million euros (in 20,067 separate claims, 2 % of the total).
Flooding is the most important natural peril in Spain, as it is in the rest of Europe, and was the cause for 69 % of the compensation paid. By importance, wind damage (windstorms qualifying for the label of Atypical Cyclonic Storm, or TCA for the Spanish) is the second cause. That is, hydrometeorological perils caused 87 % of the total damage. The third-most important peril was geological, earthquake, which accounted for 8 % of the total damage. The extraordinary risk insurance scheme in Spain also covers damage caused by volcanic activity, but there have been no volcanic eruptions in Spain in these last 25 years, so this peril has caused no damage. Turning to the 5 % of damage caused by man, 80 % of that damage (4 % of the total), was caused by terrorist acts, 19 % by civil commotion, 1 % to action by the armed forces and law enforcement in peacetime, and less than 1 % to riots.
Figure 3 depicts the time trend in damage by year and shows that flooding was not only the largest peril in the total, it was also the most frequent and recurring risk. Flooding in 2019 was particularly noteworthy (this has been dealt with in previous issues of this magazine). We need to go back to 1983, which falls outside this time series, to find a year with as much flood loss.
Geological perils – earthquake for purposes of this paper – are less frequent but have a potentially higher impact, as can be seen from the breakdown of damage in 2011, in which the damage caused by the earthquake in Lorca (Murcia) on 11 May, the most important seismic event in the history of the CCS, is clearly prominent. Wind damage is more erratic, and there are two reasons for this. One is the dynamics of weather phenomena themselves: the atmospheric circulation is more active in some years than in others. The other is changes in how this peril has been considered under the extraordinary risk insurance scheme over the period in question. A highly technical, restrictive definition of atypical cyclonic storms was changed to another, more functional definition that added a minimum wind gust threshold, which was lowered, and also included tornados, so more and more storm damage has gained coverage under the extraordinary risk insurance scheme.
This series also reveals that, fortunately, compensation paid by the CCS for terrorist acts has also been diminishing. Cessation of activity by the ETA terrorist group towards the end of the first decade of this century has been clearly reflected in a near absence of indemnities for property damage for this cause.
Mean annual compensation for natural causes over the past 25 years has been 268 million euros, for man-made causes 13 million euros.

In millions of current euros as of 31 December 2019
N.B.: Percentage compensation for each cause has been calculated on the total for natural causes plus man-made causes.
Table 1. Compensation and number of claims for extraordinary risks for the time series 1995-2019.
There follow some conclusions resulting from our analysis of the data for the number of claims and mean costs for natural and man-made causes.
Plotting the number of claims from natural and man-made causes separately (Figures 4 and 5) shows claims from natural causes to far outnumber claims from man-made causes. The peak number of claims from natural causes was 298,130 in 2009 (mainly due to storm Klaus, which accounted for 270,161 claims), compared to a peak of 2,468 claims from man-made causes in the year 2000, mainly due to terrorism and civil disorders.
For the time series considered, 1995-2019, the mean number of claims for which the CCS paid compensation annually, for both natural causes and man-made causes, was 50,964 and 803, respectively.

Figure 4. Annual number of property damage claims for extraordinary risks due to natural causes (1995-2019).

Figure 5. Annual number of property damage claims for extraordinary risks due to man-made causes (1995-2019).
Figure 6 illustrates the mean cost per claim for man-made causes and natural causes over the time series for 1995-2019 and shows that the mean costs for natural causes are in most years lower than the mean costs for man-made causes.

Figure 6. Mean annual cost per claim for natural (green) and man-made (red) causes in 2019 euros.
1.2 LOSS RATE BY CAUSE AND RISK CATEGORY
For purposes of graphically representing the data, the different risk categories in the extraordinary risk insurance scheme rate schedule were grouped into three: homes and apartment buildings, other risks, and motor vehicles. The "other risks" group includes offices, commercial businesses, industry, infrastructure, and miscellaneous, in short, risks associated with companies, businesses, or public property.
Table 2 presents a breakdown by cause and risk category for the time series considered and discloses differences in the susceptibility of the different types of property to different causes. For example, flooding affects the other risks group more than windstorms, which have a greater impact on homes and motor vehicles. The effects of earthquake are more concentrated on homes because of where and how the most significant earthquake event occurred (the Lorca earthquake) and also because the level of insurance for infrastructure (public works), which is owned by governments, is most often not as high as for other types of risks, and accordingly infrastructure is not covered under the extraordinary risk insurance scheme.

In millions of current euros as of 31 December 2019.
Table 2. Share of property affected according to the type of natural cause (1995-2019).

In millions of current euros as of 31 December 2019.
Table 3. Share of property affected according to the type of man-made cause (1995-2019).
For man-made causes (Table 3), terrorism, riots, and civil commotion all accounted for a similar share of the other risk's category. Where there were differences was in the share of riots and civil commotion on homes and motor vehicles. Damage caused by the armed forces actions and law enforcement agencies was concentrated on homes because of the nature of the most common type of loss, where the police break into a home where a crime is being committed or criminals are hiding is the typical scenario for this kind of events.
Figures 7 and 8 illustrate the total shares of compensation paid for natural and man-made causes for each of these three groups. Damage due to natural causes was split practically equally between what we have called damage to businesses, represented by the category of other risks (51 %), and damage to non-commercial property, represented by homes and motor vehicles (49 %). For losses from man-made causes, businesses (67 %) were affected more than private property (34 %). As a whole, from all causes, the percentage damage to homes was 39 %, to motor vehicles 9 %, and the largest share, 52 % of the total, to the other risk's category, which, to reiterate, groups together the different types of economic activities.

Figure 7. Percentage compensation for natural causes by risk category (1995-2019).

Figure 8. Percentage compensation for man-made causes by risk category (1995-2019).
Looking now at the number of claims instead of at compensation, for natural and man-made causes taken together, most claims were related to homes and apartment buildings, accounting for 70 % of the total claims, compared with 17 % for other risks and 13 % for motor vehicles.
1.3 LOSS RATE BY CAUSE AND MONTH OF OCCURRENCE
Table 4 sets out the claims paid by the CCS by natural cause and month of occurrence over the time series 1995-2019.

Table 4. Claims paid by natural cause and month of occurrence (1995-2019).
Evaluating this breakdown is appropriate for hydrometeorological perils (flood and wind), as shown in Figures 9 and 10.

Figure 9. Percentage compensation for flood damage by month (1995-2019).

Figure 10. Percentage compensation for wind damage by month (1995-2019).
For flooding, claims display a pronounced tendency to be concentrated in the final months of the year, with a peak in September, with 1,475 million euros being paid out, 30 % of the total compensation paid out for flood damage in that month in the time series considered. This finding can be explained by the cut-off lows that ordinarily beset eastern mainland Spain and the Balearic Islands at that time of year. This topic was examined in greater detail in issue number 11 of
this magazine and is also dealt with by an assessment of loss rate by cause and by province below.
Compensation paid for wind damage can be observed to be concentrated in the winter months, especially January, which accounts for 50 % of the total indemnities paid for all months combined (636 million euros), followed by February, which alone accounts for 16 % of the total, 203 million euros, and November, which accounts for 12 %, 155 million euros. The four months from November to February (November plus meteorological winter) account for 85 % of the compensation paid for wind over the entire year (1,090 out of 1,279 million euros) as a result of explosive cyclogenesis or the passage of extremely active low-pressure systems with strong winds through Spain.
Just as in the case of the geological causes, the monthly distribution of losses from man-made causes does not have any seasonal component and is highly contingent on singular events of major importance.
Taking all the causes together leads to the conclusion that extraordinary risk insurance activities can be divided into six very busy months from September to February and another six more sluggish months from March to August. This is an effect of the large share of flooding and high winds, though major singular events are not to be discounted. There are always exceptions, like the heavy storms that can occur in the summer and mostly cause severe pluvial flooding.
1.4 LOSS RATE BY CAUSE AND PROVINCE OF OCCURRENCE
The ability to use the CCS's data on indemnities paid to plot on a map the areas of greatest risk by cause of loss, especially for natural causes, hydrometeorological causes in particular, can be regarded as an excellent initial tool for conducting risk assessment studies, studies on changes in conventional data observations that provide information on the possible impact of climate change, risk prevention studies, etc.
A frequency analysis providing the territorial distribution of each natural cause of loss appears below.
Provinces in which the amount of compensation is greater than or equal to the arithmetic mean of the time series for the territory of Spain as a whole plus one standard deviation appear in red; provinces where it falls within the range of the arithmetic mean plus or minus one standard deviation appear in blue, and provinces where it is less than or equal to the mean less one standard deviation appear in green.

Intra- and interannual variations in rainfall are typical of Mediterranean precipitation patterns, and together with the concentration of rainfall in short spans of time, causes flooding, ordinarily pluvial flooding, that can produce large amounts of damage. After all, Spain's Mediterranean shore is one of the main regions where high daily and hourly precipitation rates are recorded.
The historical data observations on compensation for flooding paid by the CCC in the data series considered paint quite a precise picture of the above-mentioned hydrometeorological features for the eastern and southeastern coast of mainland Spain (Figure 11). Some of the provinces most prone to flooding are Alicante, Valencia, Murcia, Málaga, and Barcelona, where indemnities for flooding have totalled 475, 423, 398, 328, and 316 million euros, respectively, over the past 25 years. These provinces and the rest of the provinces along Spain's Mediterranean coastal strip make up the geographic region that is most prone to torrential rains and is most highly exposed to abundant rainfall events in short spans of time. Frequencies higher than the national average have also been recorded in other regions near the Bay of Biscay in the north and the Lower Guadalquivir region in the south. Madrid too has higher average values, though this is quite likely an effect of exposure.
The distribution of compensation paid for earthquake by province reveals the enormous impact of the Lorca earthquake, with the indemnities paid for that single loss amounting to 522 million euros (95 % of the total). Given the low frequency of this phenomenon, it is hard to make projections based on the CCS's claims database, though the regions with the highest seismic risk can be placed in southeastern Spain, and to a lesser extent in the Pyrenees and Galicia. Besides Murcia, Melilla, Lugo, and Ciudad Real also stand out, with compensation values of 8, 2, and 1 million euros over the time series considered.

Figure 11. Distribution of property damage from flooding in relation to the national average by province.

Figure 12. Distribution of property damage from earthquake in relation to the national average by province.
Wind damage (Figure 13) is concentrated in eastern and northwestern Spain and along the Bay of Biscay. As a rule, there are two reasons for this. In northern and northwestern Spain, heavy storms and cyclones pass through or nearby, whereas in the Mediterranean region the reason is phenomena associated with deep convection, such as mesoscale convective systems or even tornadoes. Wind damage is also higher than the average in the Canary Islands, especially in the province of Santa Cruz de Tenerife. The cause can be traced to active cyclones that pass through, some tropical cyclones like tropical storm (and TCA) Delta that hit the archipelago in 2005.
The distribution of losses from man-made causes by province are attributable to socio-political reasons. For terrorism, since a substantial portion of the time period considered in this study of the past 25 years spanned the decline of ETA and the end to its activities, the period considered here in Figure 14 for purposes of graphically representing the distribution of property damage by province has been enlarged to cover the last 49 years (1971-2019). It should also be noted that some of the most eventful and painful terrorist attacks in recent years, perpetrated by Islamic terrorists, have been designed specifically to cause the greatest possible harm to persons, and in consequence they have had hardly any impact at all on this section, which focuses on property damage.

Figure 13. Distribution of property damage from wind in relation to the national average by province.

Figure 14. Distribution of property damage from terrorism in relation to the national average by province (for the period 1971-2019).
Figure 15 shows maps for riots, civil commotion, and damage caused by the armed forces and law enforcement in peacetime. Indemnities for this type of man-made damage has accounted for 20 % of the compensation paid over this time series.

Figure 15. Distribution of property damage from other man-made causes (from left to right, riot, civil commotion and armed forces-related) in relation to the national average by province (1995-2019).
2. PROPERTY DAMAGE, BUSINESS INTERRUPTION, AND PERSONAL INJURY
2.1 LOSS RATE BY CAUSE
The extraordinary risk insurance scheme pays compensation not just for property damage but also for business interruption and personal injury. To compare the loss rates for the various types (property damage, business interruption, personal injury), the time series has been shortened to 16 years (2004-2019), because the CCS began covering business interruption in 2004.
Table 5 summarises the main figures for these three lines of insurance. Damage from natural causes, both property damage and business interruption, is the source of most of the compensation paid out by the CCS, 98 % and 97 %, respectively (at 5,258 and 160 million euros, respectively). In both cases flooding is the natural cause responsible for the most damage (3,511 and 106 million euros, respectively, that is, 65 % and 64 % of the total for all causes).

Table 5. Number of claims, compensation (in millions of 2019 euros), and percentage compensation for the property damage, personal injury, and business interruption lines of insurance over the period 2004-2019.
Windstorm also ranks second for compensation paid both for property damage and for business interruption, at 23 % and 22 %, respectively, of the total from man-made and natural causes.
By contrast, man-made causes are mainly responsible for compensation payments for personal injury, accounting for 91 % of the total from both natural and man-made causes (66 million euros). Terrorism is the cause responsible for the most compensation (65.98 million euros).
The high number of claims for personal injury caused by terrorism processed over the time series considered was due mainly (2,895 claims processed) to the terrorist attacks of 11 March and 3 April 2004 in Madrid and Leganés, respectively.
2.2 LOSS RATE BY THE MOST SIGNIFICANT EVENTS IN THE SERIES
Table 6 considers the events for which the most compensation has been paid over the time series for 1995-2019, namely:
- Storm Klaus, on 23 January 2009 and following days.
- The Lorca earthquake, on 11 May 2011.
- Flooding in southeastern Spain on 11-15 September 2019.

Loss in million € as of 31 Dec 2019.
Table 6. Details of the three main events over the period 1995-2019.
For all the events, property damage accounted for the bulk of the compensation paid, 98 % for both Storm Klaus and the flooding in southeastern Spain and 97 % for the Lorca earthquake.
3. PROPERTY DAMAGE: PREMIUM CONSUMPTION AND LOSS FREQUENCY
Figure 16 plots compensation paid out and surcharges collected for all the perils covered by the CCS for property damage, the main cover in terms of both volume of compensation and volume of surcharges.
Looking at the chart, we can see that for the time series considered here, compensation paid out exceeded surcharges collected for all causes covered by the CCS (natural causes and man-made causes) only in 2009, 2011, and 2019. Premium consumption was thus greater than 100 %, namely, 118 %, 105 %, and 119 %, respectively, in 2009, 2011, and 2019. Including premium accruals and all loss components (incurred but not reported provisions, expenses charged to benefits, net operating costs, and other technical and operating costs) in the premium consumption calculation would yield higher combined ratio values.
The higher consumption can be explained to a large extent because the most significant events over the time period considered took place in those three years, namely, Storm Klaus in 2009, the Lorca earthquake in May 2011, and flooding in southeastern Spain in September 2019.

Figure 16. Surcharges accrued and compensation paid for the period 1995-2019.
Finally, the sample in Table 7 has been rounded out by taking what we have called frequency, measured as the ratio of compensation to sums insured, expressed in per mille, in addition to premium consumption.
The sums insured values were collected from the statistical data sheets with data on policies subject to CCS surcharges issued or renewed in each year reported to the CCS by insurance companies annually up to and including 2018. For 2019, the data were collected from the data files submitted by insurance companies monthly during the year to report surcharges and surcharge payments.
The surcharges accruing were those published in the CCS's annual reports without discounting the collection fee (5 %) kept by insurers to cover management costs. The sums collected were for all causes covered by the CCS's extraordinary risk insurance scheme, both natural and man-made.

Table 7. Time series for exposure and loss rates, 1995-2019.
The Table reveals a rising trend in sums insured since the start of the time series. Sums insured have risen by 187 % from 1995 to 2019. Surcharges accruing have also followed a rising trend, though less marked, chiefly because of changes in the extraordinary risk surcharge rates. Surcharges have risen by 99 % from 1995 to 2019.
As we will see below, the same is not the case to the same extent for compensation paid out by the CCS.
Figure 17 plots property damage, loss rates, surcharges, and capital exposure for all causes over the time series considered.

Figure 17. Trends for capital exposure, surcharges, and loss rates over the period 1995-2019.
Coverage of extraordinary risks by the CCS has proven to be a necessary system in view of the aggregated capital exposure and the variable behaviour of losses, a feature intrinsic to the perils covered, which calls for making provisions for compensation over time, i.e., the equalisation reserve held by the CCS. It has also proven to be both effective, in that the national government has not had to pay in any contributions, as permitted by law should available funds be insufficient, and efficient, capable of flattening surcharges despite increased exposure and hence risk.