The regulatory framework for reporting and paying Consorcio de Compensación de Seguros (the CCS or Consorcio) surcharges has remained essentially unchanged since 2004. Recent technological advances impacting the systems that insurance companies use to process and exchange information more efficiently and securely, and their ability to do so, have made it possible to undertake procedural and operational enhancements to the content of reporting and paying surcharges to the Consorcio to enable it to perform its various activities ('extraordinary’ risk coverage, insurance company liquidations, and the automobile insurance guaranty fund) and to the information on the perils covered by the CCS.
These enhancements have taken the form of the new surcharge reporting system (abbreviated SIR after the Spanish, "Sistema de Información de Recargos") that took effect on 1 January 2019.
The regulatory framework consists of:
The main objectives of this new system are:
- Reporting to the CCS: (i) the identifying particulars of the policies on which surcharges are charged and (ii) the location of the perils covered.
- Adapting the surcharge reporting and payment system to an updated functional and digital environment with use of proven operational and technical media by insurers in the framework of agreements, secure information exchange, temporal traceability of surcharge reporting and payment, and a streamlined reporting and debit system.
- For companies, bringing on stream technical improvements to facilitate surcharge reporting and payment, e.g., automatic report form generation, and to facilitate direct reporting and clearing of refunds during the policy period.
Using this system, insurance companies supply detailed information on such transaction particulars of their policies as coverage inception and expiry dates, geographic location, sums insured and limits, surcharges, and instalment interest. The SIR therefore represents a milestone in data traceability.
The table below summarises the details reported by insurers:

Figure 1. Information reported by insurers using the SIR.
Now that this new surcharge reporting system has been put into context, the purpose of this paper can be said to be three-fold:
- To present and analyse the data on policies and sums insured for the year 2019 obtained using the SIR.
- To discuss possible improvements that could be effected to increase the quality of the data based on this analysis of the data for the first year under the new system.
- To consider the scope of all these data in future.
1. Data on policies and sums insured for 2019 collected using the SIR
Our presentation and analysis of the data will distinguish among extraordinary risk insurance surcharges on property damage, pecuniary loss (business interruption), and personal injury insurance.
The information set out in the following tables concerning the number of policies and sums insured refers to those in effect on 31 December of each year plus term policies issued or renewed during the year, except for 2019, which refers to exposure as of 31 December 2019.
Sums insured are in euros current as of 31 December 2019.
A) Property damage
The
number of policies for 2019 by risk category using the SIR is:
| Number of policies by risk category 2019 |
| Year |
Homes and Apartment Buildings |
Offices |
Commercial and other Simple Risks |
Industry |
Infrastructures |
Automotive Vehicles |
Total |
| 2019 |
19,628,912 |
275,397 |
3,093,766 |
696,599 |
139 |
28,274,846 |
51,969,659 |
Figure 2. Number of policies by risk category. Property. 2019.
"Commercial and other simple risks" and "Industrial" apportioned as in 2018.
Let us now compare those data with the data for the previous year, 2018, when the data were taken from statistical data sheets submitted to the CCS by insurers. This will provide a look at the consistency of the information extracted from the SIR.
The data for 2018 are:
| Number of policies by risk category 2018 |
| Year |
Homes and Apartment Buildings |
Offices |
| Commercial and other Simple Risks |
|
|
|
Automotive Vehicles |
Total |
| 2018 |
22,728,386 |
258,295 |
1,945,457 |
438,043 |
205 |
28,303,197 |
53,673,583 |
Figure 3. Number of policies by risk category. Property. 2018.
We can see that the number of policies reported fell from 53.67 million in 2018 to 51.97 million in 2019. That is, a 3.2 % decrease from one year to the next. The largest decrease was for homes and apartment buildings, which dropped from 22.73 million in 2018 to 19.63 million in 2019.
This being said, we would point out that our conclusion is not that the number of policies taken out decreased from 2018 to 2019 but rather that, firstly, the data have been refined, and the 2019 value of 51.9 million policies identified by insurer and by policy number is considered more reliable; and, secondly, the 2018 data for policies issued or renewed during the year and the 2019 data for policies active on 31 December 2019 are not exact equivalents.
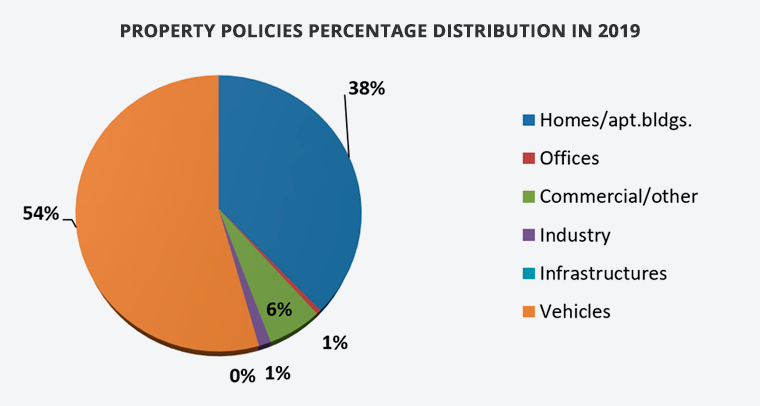
Figure 4. Percentage distribution of policies by risk category. Property. 2019.
We can observe that over half the policies, 54 % of the total, were for motor vehicles. This was followed by homes and apartment buildings, at 38 %.
The time trend for the number of policies over the past 20 years (2000 to 2019) is shown below. Note that through 2018 the data were collected from statistical data sheets submitted to the CCS by insurers while the 2019 data were compiled from the SIR.
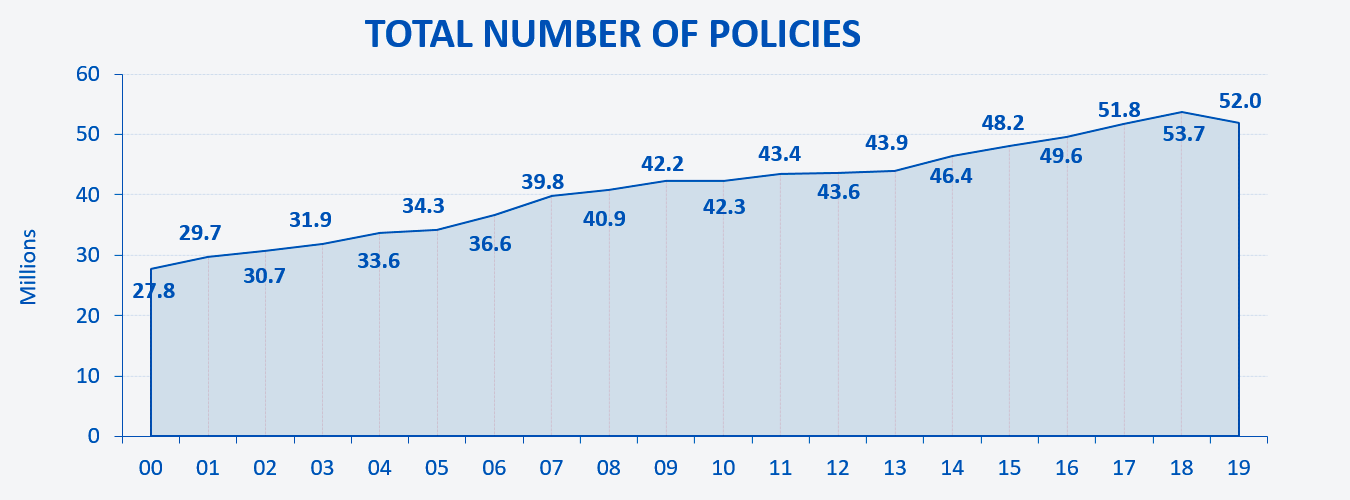
Figure 5. Time trend for the number of policies. Property damage. Time series for 2000-2019.
The number of property policies followed an upward trend over the time series considered, and the 2019 value from the SIR is similar to those for previous years.
The sums insured for 2019 by risk category from the SIR data follow:
| Sums insured by risk category 2019 |
| Year |
Homes and Apartment Buildings |
Offices |
Commercial and other Simple Risks |
Industry |
Infrastructures |
Total |
| 2019 |
3,737,564,527,445 |
172,815,296,689 |
696,330,062,005 |
1,196,005,763,372 |
7,658,636,508 |
5,810,374,286,020 |
Figure 6. Sums insured by risk category. Property damage. 2019.
"Commercial and other simple risks" and "Industrial" apportioned as in 2018.
The values for sums insured in 2018 were:
| Sums insured by risk category 2018 |
| Year |
Homes and Apartment Buildings |
Offices |
Commercial and other Simple Risks |
Industry |
Infrastructures |
Total |
| 2018 |
4,043,626,198,788 |
104,736,420,637 |
576,127,983,718 |
989,548,529,592 |
7,138,565,609 |
5,721,177,698,343 |
Figure 7. Sums insured by risk category. Property damage. 2018.
N.B.: There are no data for the sums insured for motor vehicles, because surcharges are charged as a fixed amount by motor vehicle type, hence that information is not needed to calculate the surcharges, and insurers also do not know the value, because the market value of all motor vehicles in operation is constantly changing. Therefore, the worth of motor vehicles is in addition to the sums insured set forth here.
Sums insured increased by 1.6 % from 2018 to 2019. That value is the meaningful variable, since it determines the surcharges collected by the CCS and its maximum coverage exposure. The increase was recorded for all risk categories except homes and apartment buildings, which decreased, just like the number of homeowner policies.

Figure 8. Percentage distribution of sums insured by risk category. Property damage. 2019.
Homes and apartment buildings can be seen to account for 64 % of the total sums insured, followed by industry at 21 % of the total.
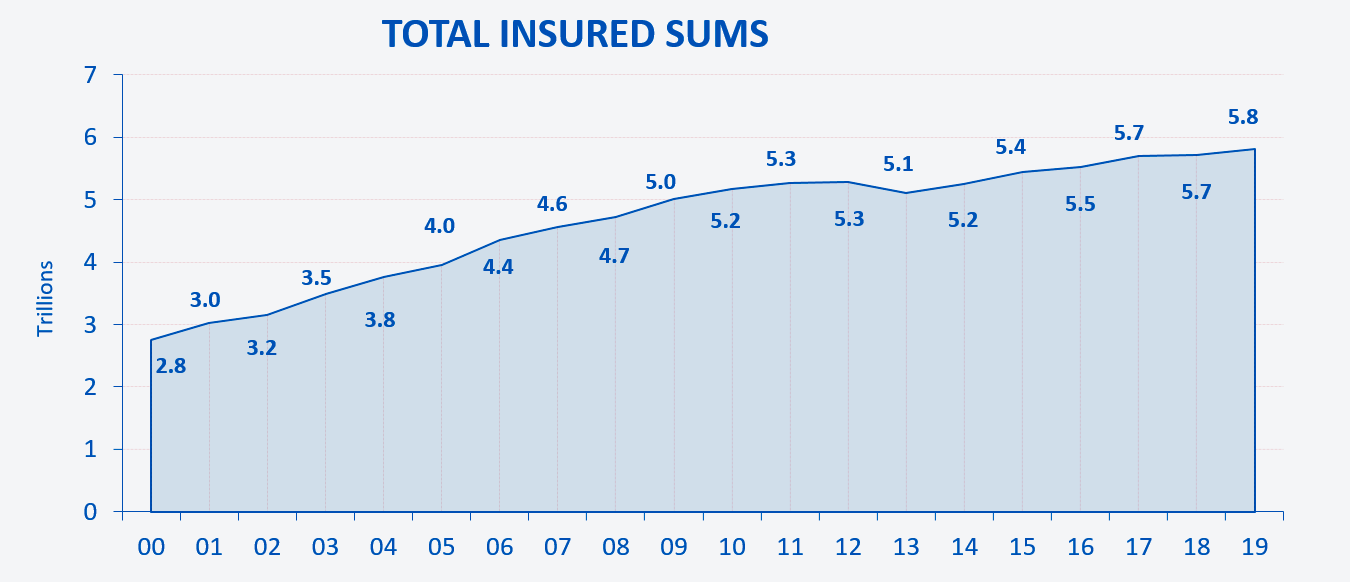
Figure 9. Time trend for sums insured. Property damage. Time series for 2004-2019.
The time trend for sums insured over the past 20 years (2000 to 2019) exhibits a rising trend over the entire period, and the increase recorded for 2019 would appear to be consistent with the values for the series as a whole.
The property data for 2019 compiled from the SIR are summarised below:
Number of policies, sums insured, and mean sums insured by risk category 2019
| Risk Category |
No. of Policies |
% |
Sums Insured |
% |
Mean Sums Insured |
| Homes and Apartment Buildings |
19,628,912 |
37.8 |
3,737,564,527,445 |
64.3 |
190,411 |
| Offices |
275,397 |
0.5 |
172,815,296,689 |
3.0 |
627,513 |
| Other: Commercial, Industrial, Sundry |
3,790,365 |
7.3 |
1,892,335,825,377 |
32.6 |
499,249 |
| Infrastructures |
139 |
0.0 |
7,658,636,508 |
0.1 |
55,098,104 |
| Motor vehicles |
28,274,846 |
54.4 |
- |
- |
- |
| Total |
51,969,659 |
100 |
5,810,374,286,020 |
100 |
245,217 |
Figure 10. No. of policies, sums insured, and mean sums insured by risk category. 2019.
N.B.: There are no records for the sums insured for motor vehicles, and that value has not been taken into account when calculating the total mean sums insured values.
To end this section, we would point out that the data for the sector for 2019 compiled from the SIR were consistent with the data for 2018 compiled from the previous system of statistical data sheets submitted to the CCS by insurers and with the time series considered.
Based on the data reviewed up to this point, the SIR appears to have worked as expected during its first year of operation. Nevertheless, we would note that a series of steps intended primarily to improve data quality are needed to increase data utility and enhance usage of all this information from the SIR. These steps will be discussed in the course of this paper.
B) Business interruption
The
number of policies for 2019 by risk category is:
| Number of policies by risk category 2019 |
| Year |
Homes and Apartment Buildings |
Offices |
Commercial and other Simple Risks |
Industry and Infrastructures |
Motor Vehicles |
Total |
| 2019 |
14,090,911 |
196,212 |
1,146,838 |
199,144 |
541,260 |
16,174,264 |
Distribution by risk category as apportioned in 2018.
Figure 11. Number of policies by risk category. Business interruption. 2019.
| Number of policies by risk category 2018 |
| Year |
Homes and Apartment Buildings |
Offices |
Commercial and other Simple Riskss |
Industry and Infrastructures |
Motor Vehicles |
Total |
| 2018 |
14,979,727 |
184,309 |
1,077,818 |
187,159 |
508,685 |
16,937,698 |
Figure 12. Number of policies by risk category. Business interruption. 2018.
Comparing these data with the data for 2018 from the statistical data sheets submitted to the CCS by insurers yearly, the number of policies declined from 16.94 million policies in 2018 to 16.17 million policies in 2019, a 4.5 % decrease from the previous year.

Figure 13. Percentage distribution of policies by risk category. Business interruption. 2019.
Business interruption policies for homes and apartment buildings can be seen to account for 87 % of the total, followed by commercial and other simple risks at 7 % of the total.
The time trend for the number of business interruption policies since 2004, the year in which this cover was included in the extraordinary risk coverage scheme, is shown below.

Figure 14. Time trend for the number of policies. BI. Time series for 2004-2019.
The sums insured for 2019 and 2018 by risk category follow:
| Insured sums by risk category 2019 |
| Year |
Offices |
Commercial and other Simple Risks |
Industry and Infrastructures |
Motor Vehicles |
Total |
| 2019 |
16,397,048,950 |
102,716,773,710 |
206,329,255,188 |
535,697,204 |
325,978,775,053 |
Distribution by risk category as apportioned in 2018.
Figure 15. Sums insured by risk category. BI. 2019.
| Insured sums by risk category 2018 |
| Year |
Offices |
Commercial and other Simple Risks |
Industry and Infrastructures |
Motor Vehicles |
Total |
| 2018 |
15,856,865,040 |
99,332,875,264 |
199,531,950,125 |
518,049,211 |
315,239,739,640 |
Figure 16. Sums insured by risk category. BI. 2018.
N.B.: There are no data for the sums insured for homes and apartment buildings, because that information is not needed to calculate the surcharges, and the value is not known to insurers in all cases. The business interruption value for homes and apartment buildings is in addition to the sums insured set out here.
Sums insured for business interruption increased by 3.4 % from 2018 to 2019.

Figure 17. Percentage distribution of sums insured by risk category. BI. 2019.
The largest sums insured were for industry and construction, which accounted for 63 % of the total, followed by commercial and other simple risks, which made up 32 %.
Time trend for sums insured for the period 2004 to 2019:
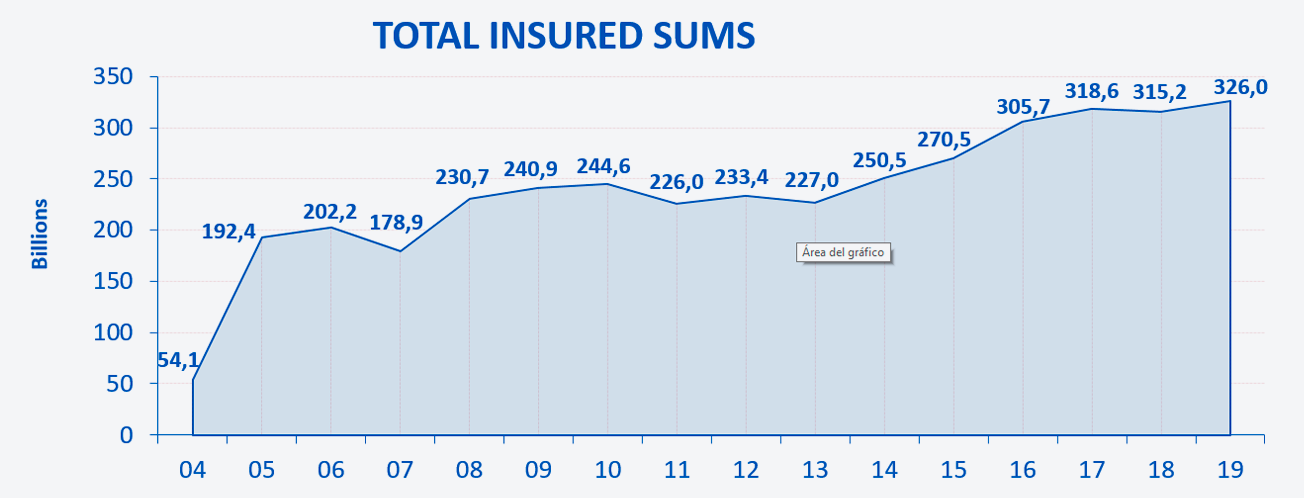
Figure 18. Time trend for sums insured. Business interruption. Time series for 2000-2019.
The summary for business interruption by risk category in 2019 appears below:
Number of policies, insured sums, and mean insured sums by risk category 2019
| Risk Category |
No. of Policies |
% |
Insured Sums |
% |
Mean Insured Sums |
| Homes and Apartment Buildings* |
14,090,911 |
87.1 |
- |
- |
- |
| Other Risks |
2,083,353 |
12.9 |
325.978.775.053 |
100 |
156,468 |
| Total |
16,174,264 |
100 |
325,978,775,053 |
100 |
156,468 |
* Does not include "Insured Sums", because this value is not a factor for calculating the Fund's surcharges for BI, which are here based on the insured sums for property damage.
Figure 19. No. of policies, sums insured, and mean sums insured by risk category. BI. 2019.
To end this section, we would point out that the data for 2019 compiled from the SIR were consistent with the business interruption data on record for previous years.
C) Personal injury
The
number of policies by type of insurance in 2019 and 2018 are shown below:
| Number of policies by type of insurance 2019 |
| Year |
Accident and Life Risk Insurance |
Accident Insurance for Travel paid by credit card |
Total |
| 2019 |
51,720,143 |
162 |
51,720,305 |
| Number of policies by type of insurance 2018 |
| Year |
Accident and Life Risk Insurance |
Accident Insurance for Travel paid by credit card |
Total |
| 2018 |
59,209,900 |
1,846 |
59,211,746 |
Figure 20. Number of policies by type of insurance. Personal injury. 2019 and 2018.
The percentage distribution of the number of personal injury policies for 2019 by type of insurance is as follows:
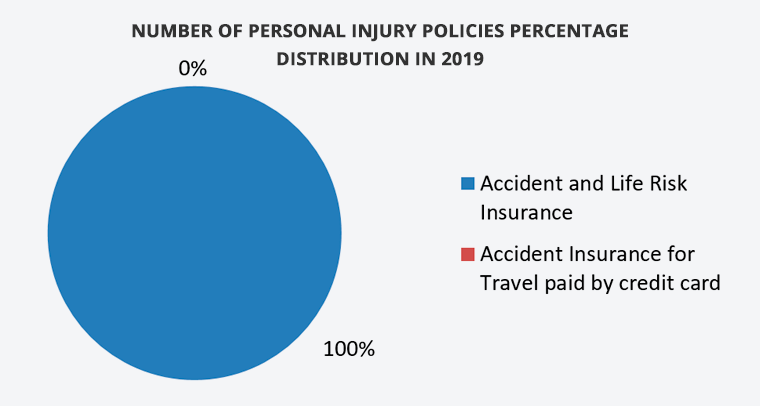
Figure 21. Percentage distribution of no. of policies by type of insurance. 2019.
Accident insurance policies for travel paid by credit card did not account for even 1 % of the total. There were 162 policies of that kind out of 51.7 million total personal loss policies in 2019.
The time series trend for the number of policies for the period 2000-2019 is:
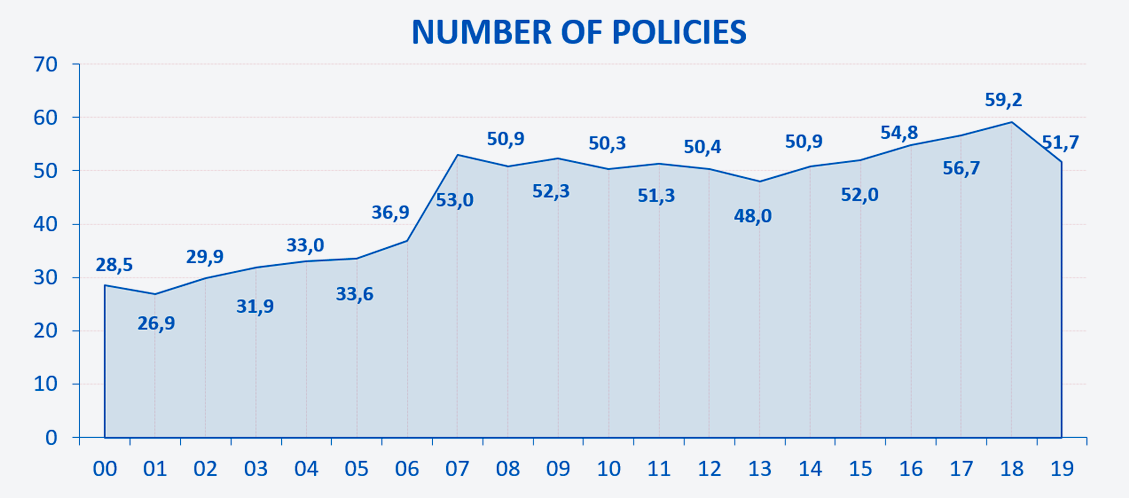
Figure 22. Time trend for the number of policies. Personal injury. Time series for 2000-2019.
We would again say that our conclusion is not that the number of policies taken out decreased from 2018 to 2019 but rather that, firstly, the data have been refined, and the 2019 value of 51.7 million policies, each identified by their insurer and policy number, is considered more reliable; secondly, the 2018 data for policies issued or renewed during the year and the 2019 data for policies active on 31 December 2019 are not exact equivalents; and thirdly, the 2019 data do not include multi-year policies, whole life or term, that have an inception date and surcharge collection date earlier than 1 January 2019.
The sums insured for 2019 and 2018 by type of insurance are:
| Insured Sums by Type of Insurance 2019 |
| Year |
Accident and Life Risk Insurance |
Accident Insurance for Travel paid by credit card |
Total |
| 2019 |
5,783,732,830,881 |
2,314,941,784,927 |
8,098,674,615,808 |
| Insured Sums by Type of Insurance 2018 |
| Year |
Accident and Life Risk Insurance |
Accident Insurance for Travel paid by credit card |
Total |
| 2018 |
5,782,373,903,270 |
5,597,422,817,039 |
11,379,796,720,310 |
Figure 23. Sums insured by type of insurance. Personal injury. 2019 and 2018.
The percentage distribution of sums insured for 2019 by type of insurance is as follows:

Figure 24. Distribution of sums insured. Personal injury. 2019.
It can be noted that 71 % of the sums insured were for accident and Life Risk insurance and 29 % for accident insurance for travel paid for by credit card.
The time trend for sums insured for personal injury for the periods 2000-2019 and 2010-2019 is represented graphically below:
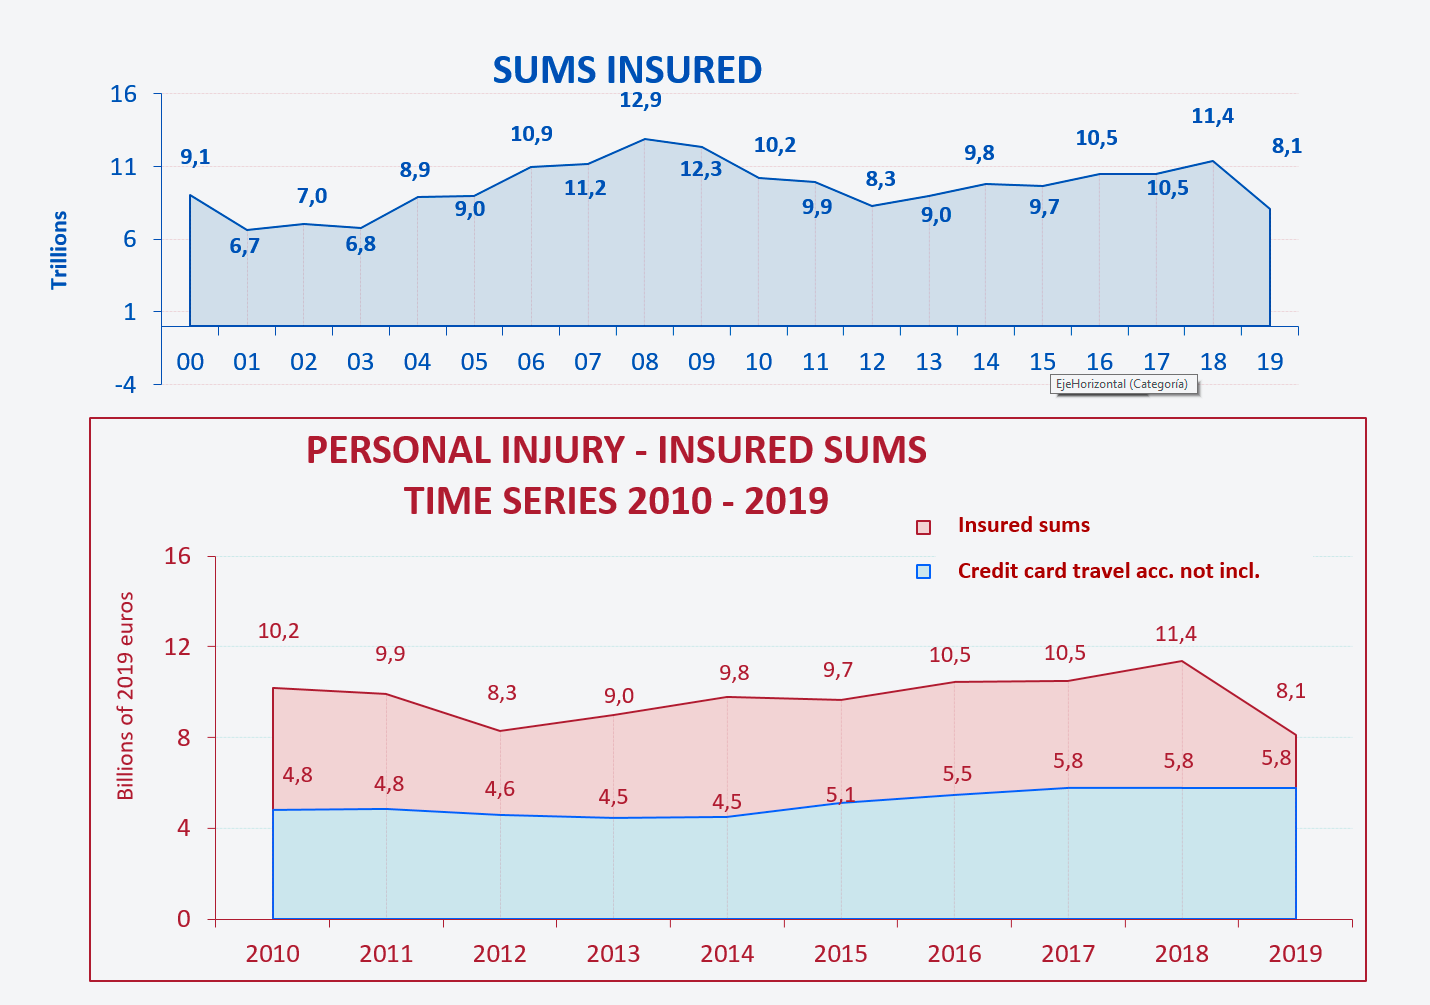
Figure 25. Time trend for sums insured. Personal injury. Time series for 2000-2019 and 2010-2019.
The decrease in sums insured from 2018 to 2019 was due to the same causes as for the number of policies and further to a substantial reduction in the sums insured under accident insurance policies for travel paid by credit card. Though this makes up a large proportion of sums insured (29 % of the total), it represents a very small percentage of its surcharge base, because these insurance policies have a reduced rate.
The number of policies, sums insured, and mean sums insured for 2019 by risk category are shown below by way of a summary from the personal injury data:
Number of policies, sums insured, and mean sums insured by risk category 2019
| Risk Category |
No. of policies |
% |
Sums Insured |
% |
Mean Sums Insured |
| Accident and Life Risk Insurance |
51,720,143 |
100.0 |
5,783,732,830,881 |
71.4 |
11,827 |
| Accident Insurance Travel paid by credit card |
162 |
0.0 |
2,314,941,784,927 |
28.6 |
14,289,764,104 |
| Total |
51,720,305 |
100 |
8,098,674,615,808 |
100 |
156,586 |
Figure 26. No. of policies, sums insured, and mean sums insured by risk category. 2019.
Following the preceding analysis and discussion of property damage, business interruption, and personal injury data, there follows a summary of the number of policies and sums insured for those three types of insurance in 2019:
Policies and insured sums 2019
| 2019 |
No. of Policies |
Insured Sums |
| Property damage |
51,969,659 |
5,810,374,286,020 |
| Business interruption |
16,174,264 |
325,978,775,053 |
| Personal injury |
51,720,305 |
8,098,674,615,808 |
Figure 27. 2019 data on policies and sums insured.
Where a single policy includes covers for more than one of the preceding types of insurance, property damage, business interruption, and/or personal injury, it is counted as a separate policy for each of the types concerned. This results in an appreciable increase in the overall number of policies, whereas the sums insured are divided among the different types.
The conclusions that can be drawn following this analysis of the data on the number of policies and sums insured for 2019 using the SIR and comparison with the data for 2018 and the time series are:
- The overall data for the insurance sector for 2019 are uniform and consistent with the data for previous years.
- Errors by certain insurers in the reporting procedure have been detected and have had to be addressed. This was attributable to the system's inherent flexibility in data entry and reporting by insurers during the first year of operation.
- In relation to this same aspect, there remains considerable room for improvement of the quality of the data in the SIR.
As we have just mentioned, the quality of the information reported by insurers using the SIR can be optimised, so the next section deals with prospects for improving the SIR data and the scope of the information in the future.
2. Prospects for improving the information reported using the SIR
Now that the SIR collection system has been implemented and is operational, CCS's goal is to achieve substantial improvements in the quality of the data reported by insurance companies.
To that end, two measures will be undertaken:
- New transaction data validation will be added to the SIR application to improve the quality of the data reported by insurers.
This change will require some insurance companies to change their procedures to meet the new requirements for data files submitted to the Fund. The application will flag deficiencies in the information in the files that have been sent, and these deficiencies will have to be corrected before the system will allow the insurance company's file to be processed. No processing will be possible until the deficiencies in the file have been corrected, and as a result the report will not be deemed to have been properly submitted on time.
Insurance companies will be given sufficient advance notice of implementation of these changes to enable them to make preparations to fulfil the new requirements during 2021, so that the data for that year will be of better quality, and complete and fully valid information will be available in January 2022.
The following compulsory requirements will be established for files reported by insurance companies to improve the quality of the data reported for processing using the SIR: (i) consistency between total values reported, limits of indemnity, and surcharges for exceptional risk coverage will be required; (ii) the post code data item for risk location will have to be a valid code in the Post Office's post code database; and (iii) consistency will also be required for the dates reported, e.g., between the inception data and date of expiry of the coverage.
These measures are intended to help companies complete their files with data of good quality, with a view to improving the data available and the utility and operation of the SIR.
- Measures dealing with aggregated results at the policy or insurer level, that is, with transactions already reported.
These measures will entail subsequent validation to detect incidents for specific policies or insurance companies when the relationship between the surcharge, limits, and capital exposure is outside the bounds established by the rate algorithm or when values are outside the range or are inconsistent with values reported in previous years. If these types of discrepancy are found, the insurer will be contacted to review the data.
3. Scope of future data reporting
CCS's new Surcharge Reporting System (SIR), which became operational in January 2019, represents a milestone in data traceability and calls for a global approach to analysing, processing, and using the data so that the information will be more useful.
By implementing the measures discussed in this paper and others that will become apparent in the course of time, the Fund will be able to expand and improve its information. Namely:
- Data on capital exposure will be disclosed, because the maximum sums insured, i.e., insured sums, not capital exposed, were reported in 2019.
- Data on sums insured and capital exposure will be available by geographic location (post code and province) and by category of risk.
Global information on the location of risks nationwide will be made available to insurance companies, providing them with added value over and above the efforts involved in implementing the new surcharge and data reporting model.
CCS, and the insurance sector generally, will be able to use the SIR data to disclose areas where insurance coverage is low and take steps to promote insurance in those areas. The analysis will produce findings relating to incentives to buy insurance, proactive risk reduction measures, protocols for dealing with recurring risks, and so forth.


